Share your ideas & research
You’ve built your graph, a work of beauty and insight. Now you’re ready to share what you’ve learned.
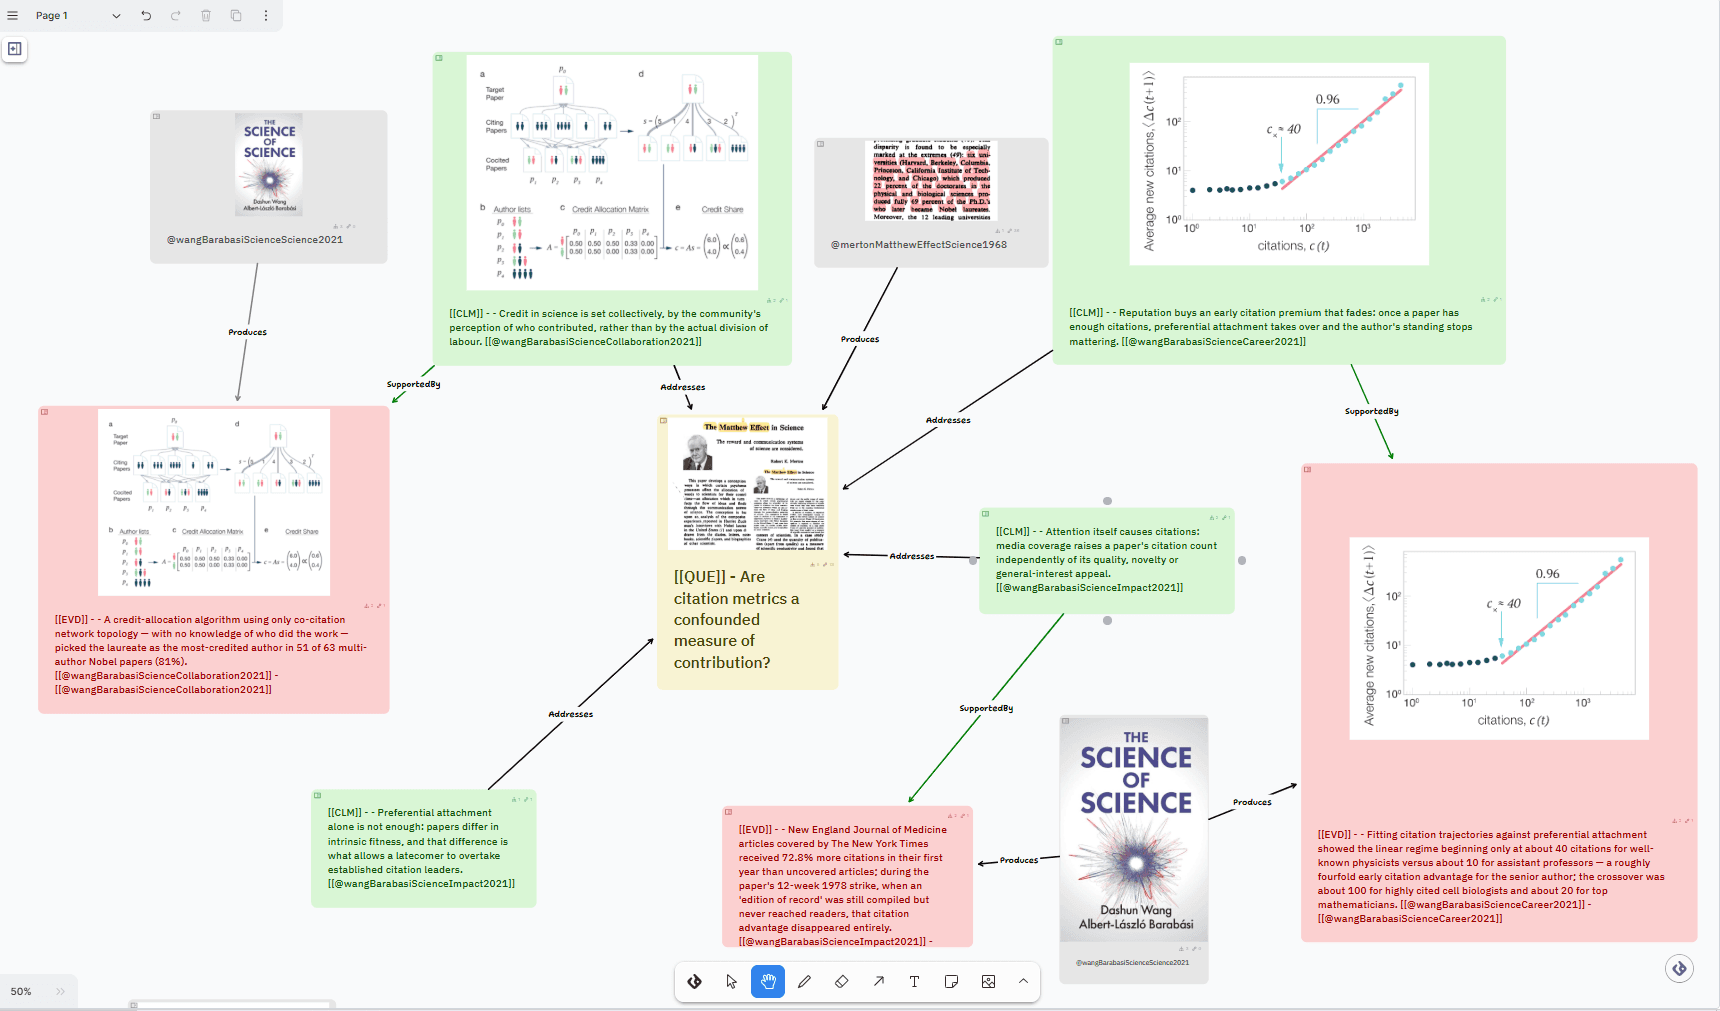
Getting eyes on the prize
- Sharing your discourse graph
- Sharing your discourse canvas
- Drafting a manuscript from your discourse graph
Sharing your discourse graph
Roam Research is cloud-hosted, and its web, desktop, and mobile clients have built-in collaboration features.
To create a multiplayer graph with shared access and authorship, go to Settings → Sharing and enter the email addresses of the people you want to share your graph with. You can also set read/write access permissions here.
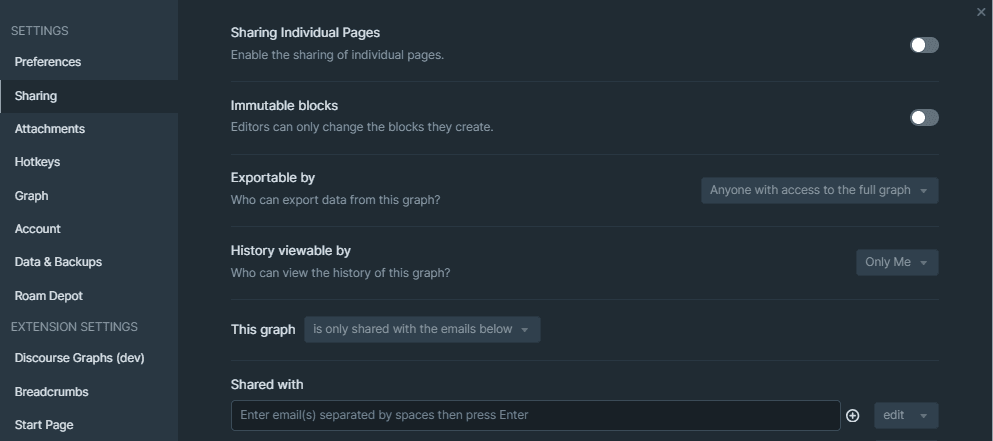
Roam graph sharing settings
Sharing your graph shares all parts of your graph; there are no private pages in a shared Roam graph.
You can share individual pages from your graph as Markdown or JSON files. These pages can be imported into another Roam graph (JSON is best for this) or read as text files (Markdown is best for this).
Exporting pages from your graph
You can also export the results of a query in a variety of human- and machine-readable formats.
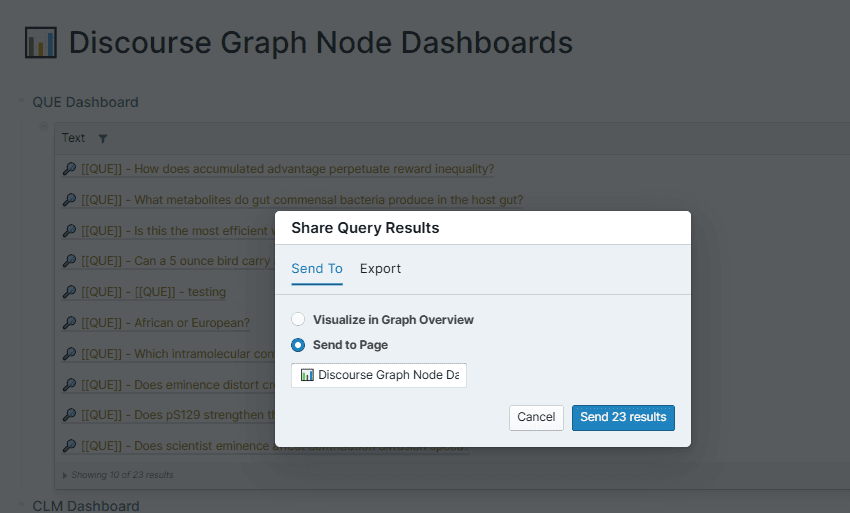
Exporting query results
Sharing your discourse canvas
Presenting your canvas
Your canvas can be used to give a PowerPoint- or Figma-like visual overview of your work.
You can start at your motivating question and move through your hypothesis to your experiments and their results, opening each node in the sidebar to show your audience relevant details.
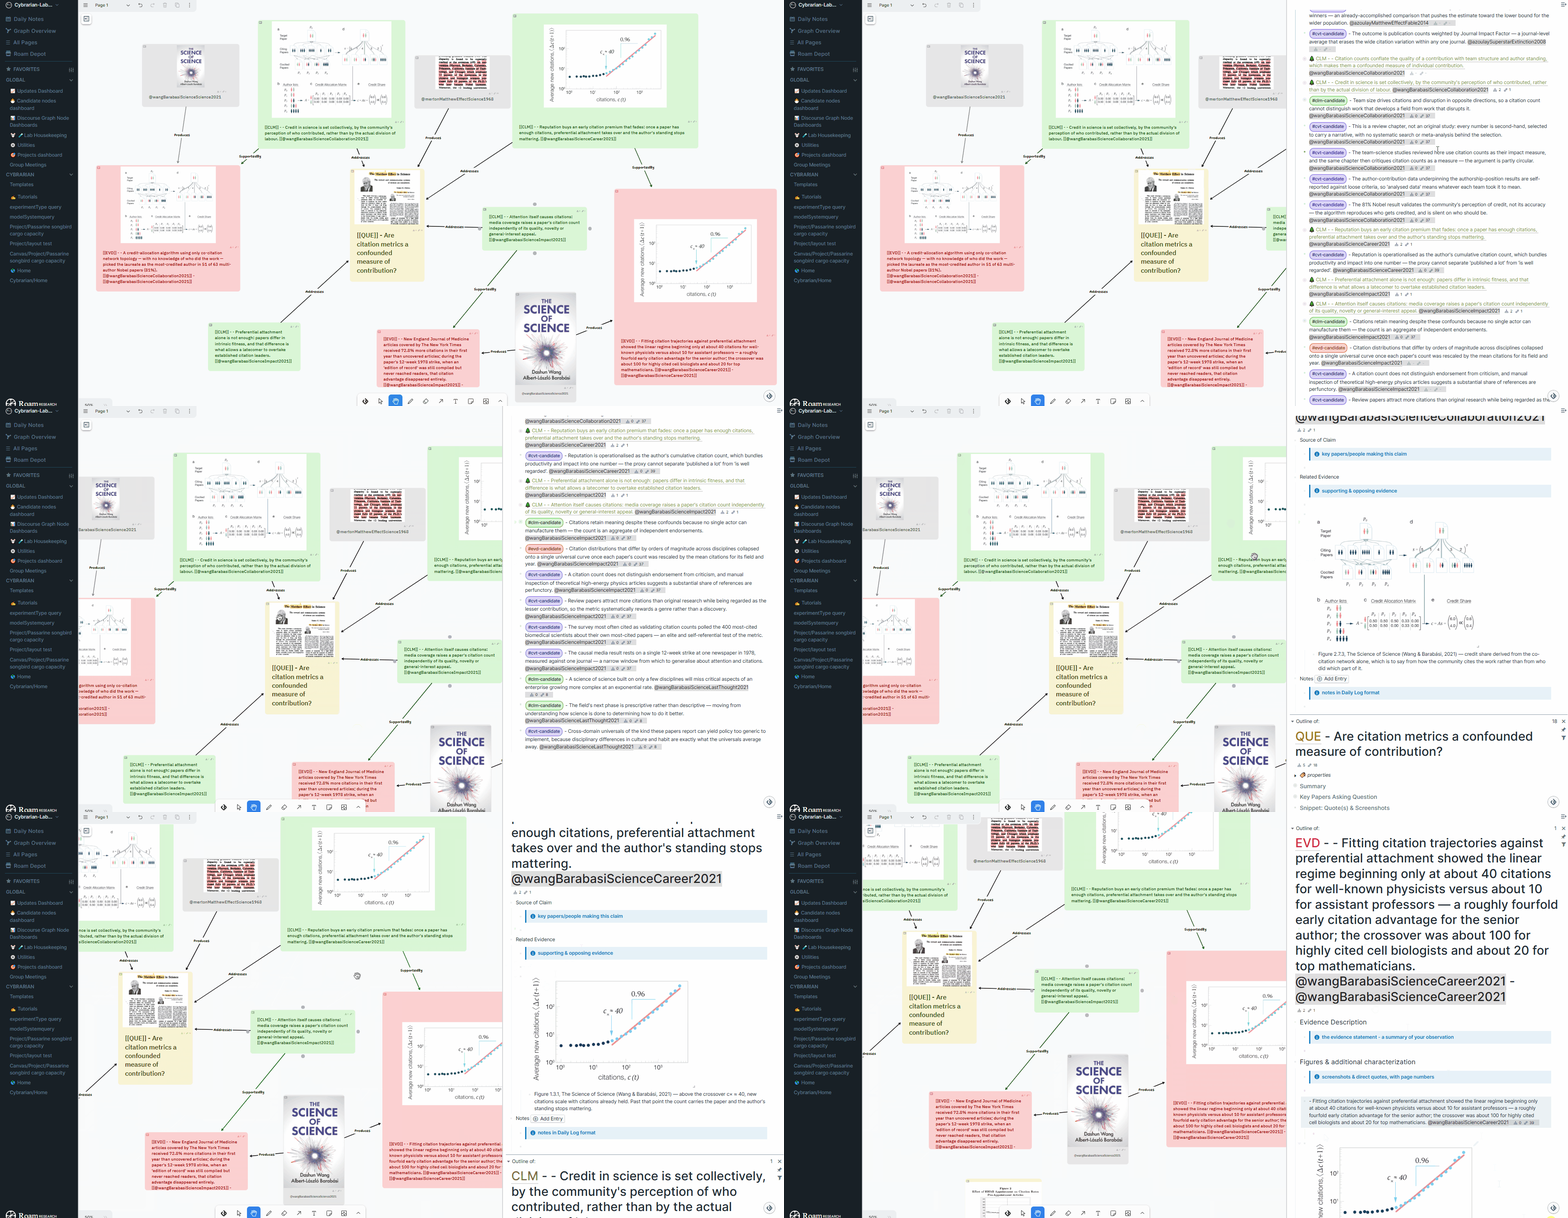
Example canvas walkthrough
You can create a “presentation view” for your discourse nodes by adding the material or images you want to highlight at the top of the page. The first image on the page is automatically selected as the image that displays on the discourse canvas.
You can modify your discourse templates to customize your presentation view. Check out this tutorial in the template lab graph for tips.
Exporting your canvas
You can export your canvas as JSON or as a static .png or .svg image.
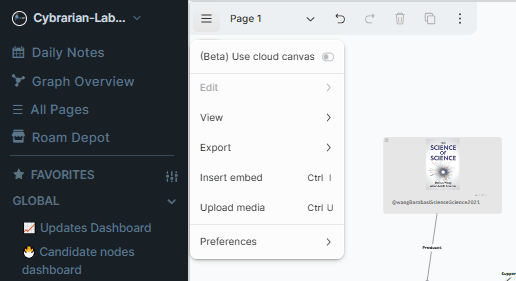
The canvas menu
It is not possible at present to export a “live” discourse canvas to another graph.
Coworking on your canvas
Any canvas in your graph can be edited or viewed by anyone who has the appropriate permissions in your graph. The cloud canvas feature supports real-time multiplayer collaboration between members of your graph: a shared whiteboard session where you can see others’ edits as soon as they appear.
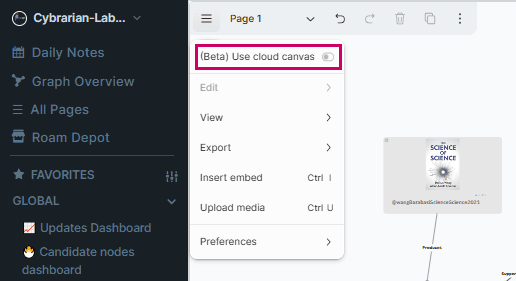
Enabling the cloud canvas
The cloud canvas is useful for shared brainstorming or manuscript planning sprints.
Drafting a manuscript from your discourse graph
Using the canvas as a storyboard
You can use the discourse canvas to organize your ideas for a paper. Your canvas lets you follow your train of thought from hypothesis formation to hypothesis testing, including the dead ends. You can see at a glance which sources (references) were crucial to the formulation of certain claims, and which informed the design of your experiments.
If you’re targeting a particular journal, you might find it helpful to spatially arrange your discourse nodes according to its manuscript submission format. This can give you a head start on the drafting stage.
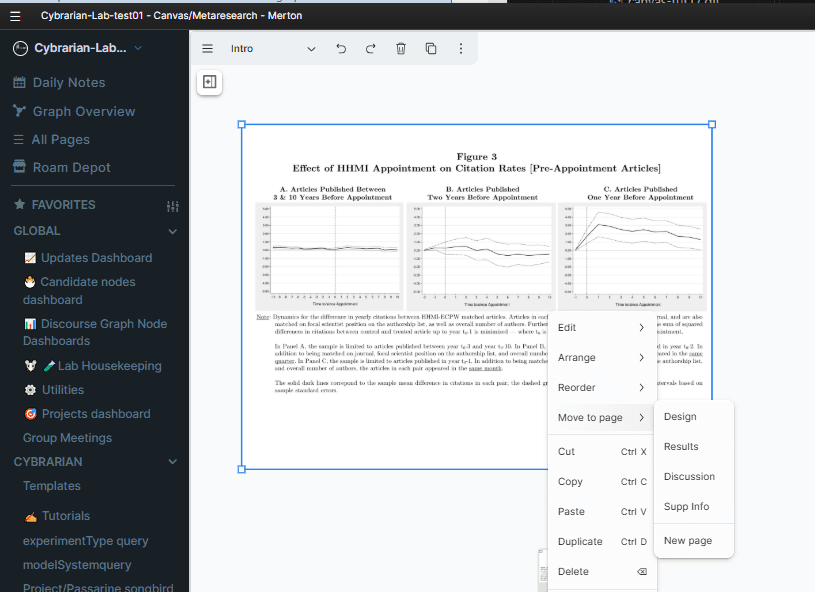
Using canvas layers to organize article sections
The canvas layout can also be used to spot “gaps” in your argument at a glance, before Reviewer #2 rushes in to fill them with part of their oeuvre.
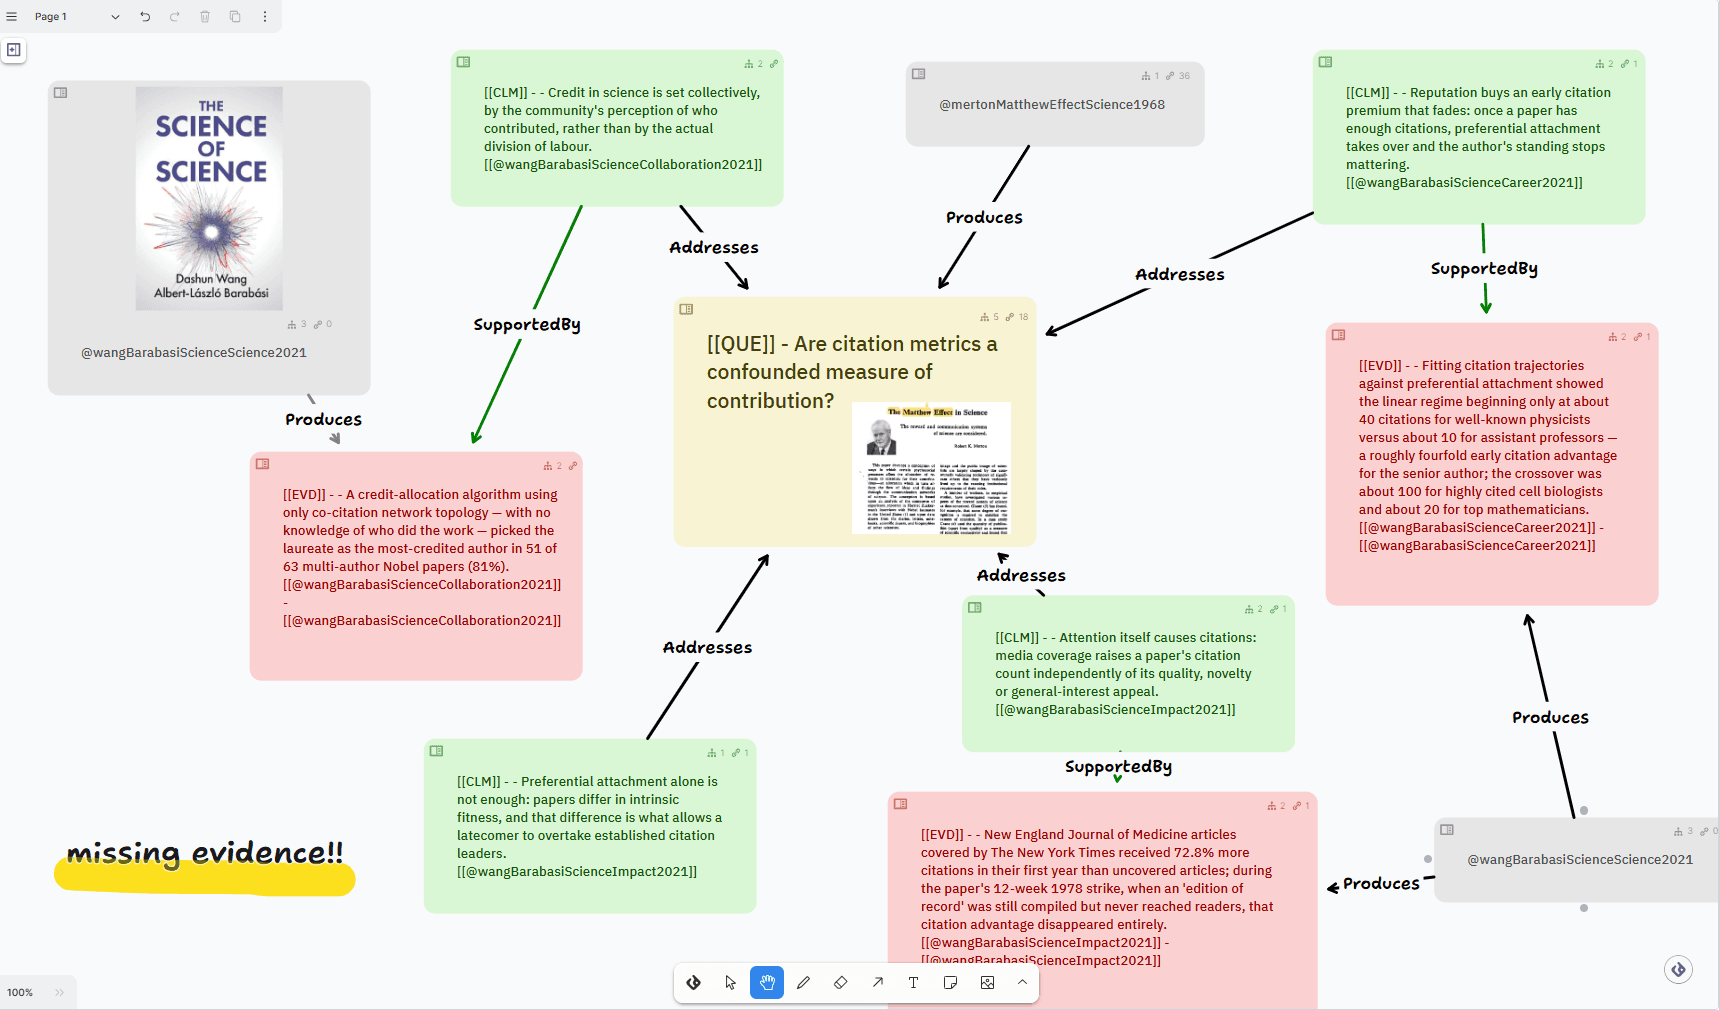
Mind the gap: spotting unsupported claims before Reviewer #2
The canvas is also useful for selecting and arranging figures, particularly for deciding which images should be composed into figure panels, and which visual evidence is crucial enough to highlight in the main body of the text versus the supplementary information.
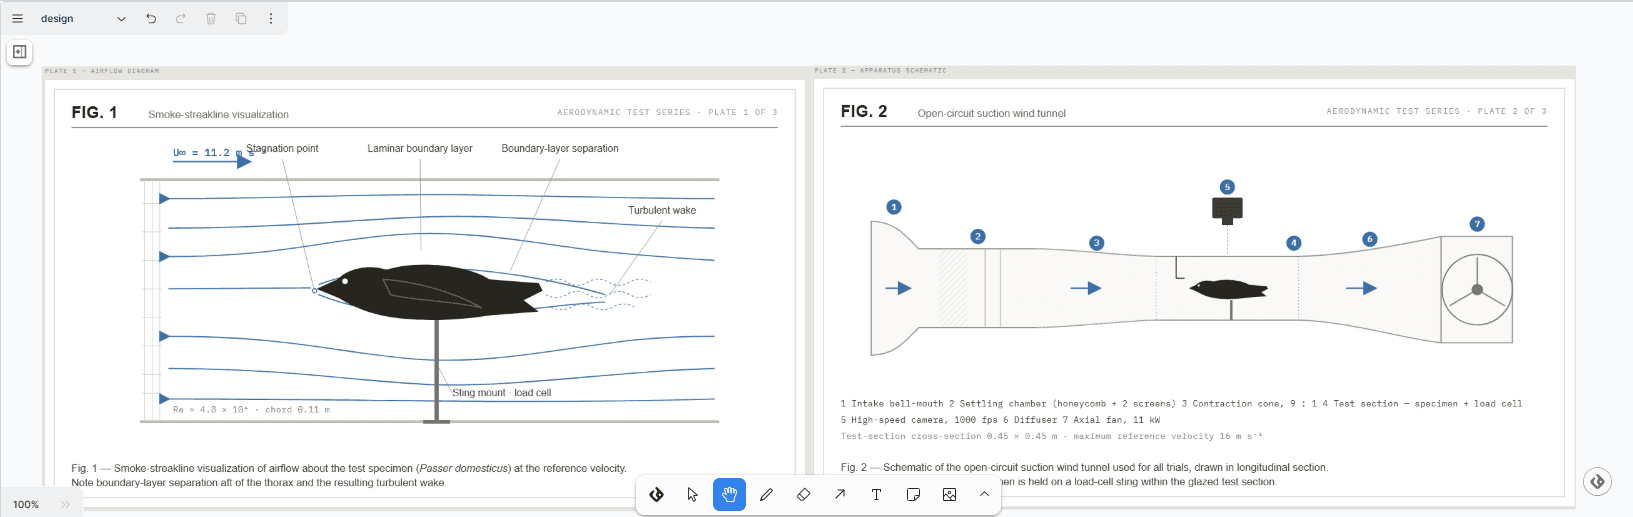
Details of the experiment can go in one section…
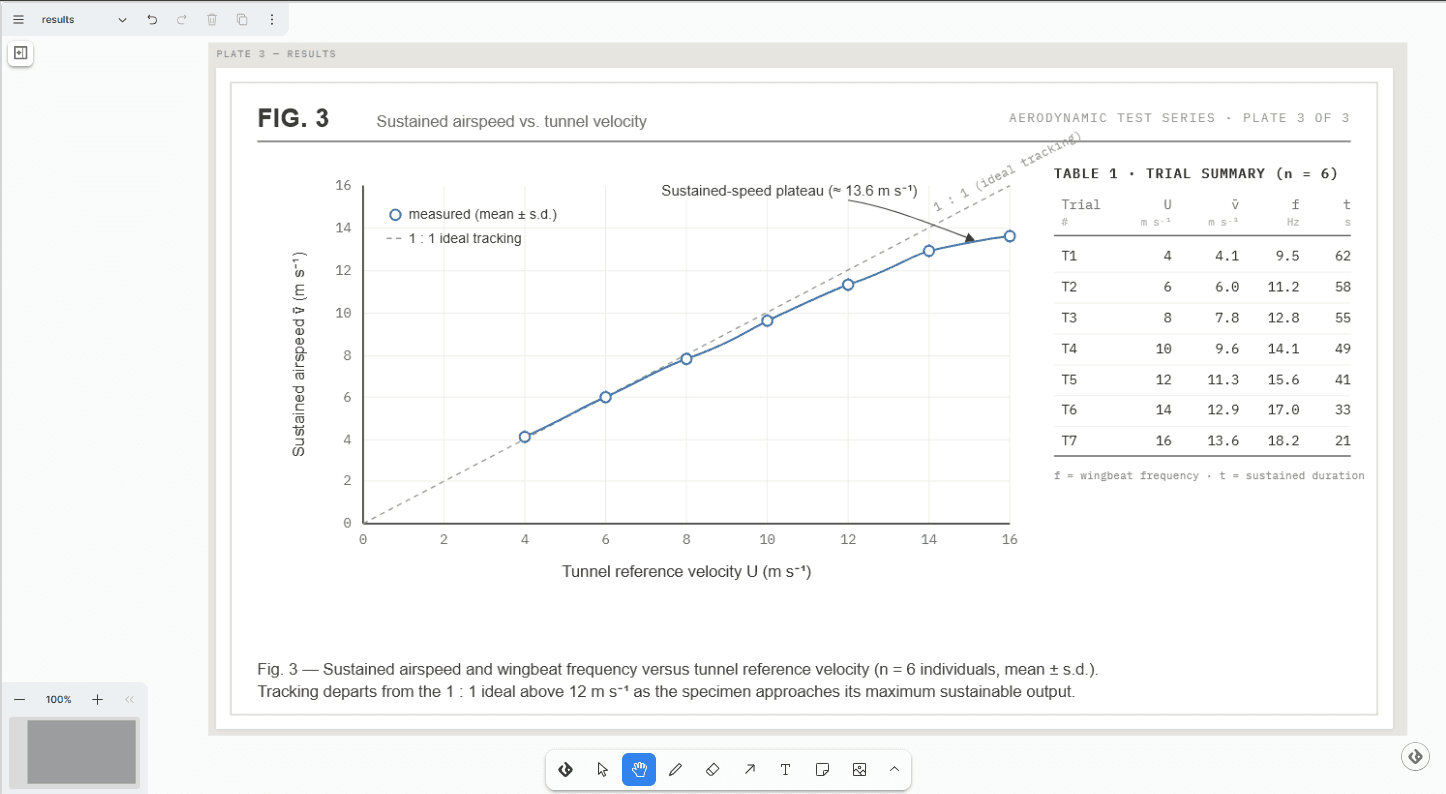
… and the results in another
Arguing with your graph
Your discourse nodes should be formulated as concisely as possible, but the rest of the page can be used to construct and elaborate your broader point. The example below links both Evidence and Caveats related to a Claim. In this discourse context, a Caveat is an observation that weakens the claim without necessarily opposing it. Some caveats may be promoted to Evidence that opposes a Claim after further investigation, others may become Issues: requests for additional analyses to clarify a point. Anticipating the most salient caveats to each of your claims is useful preparation for the review stage of your manuscript submission.
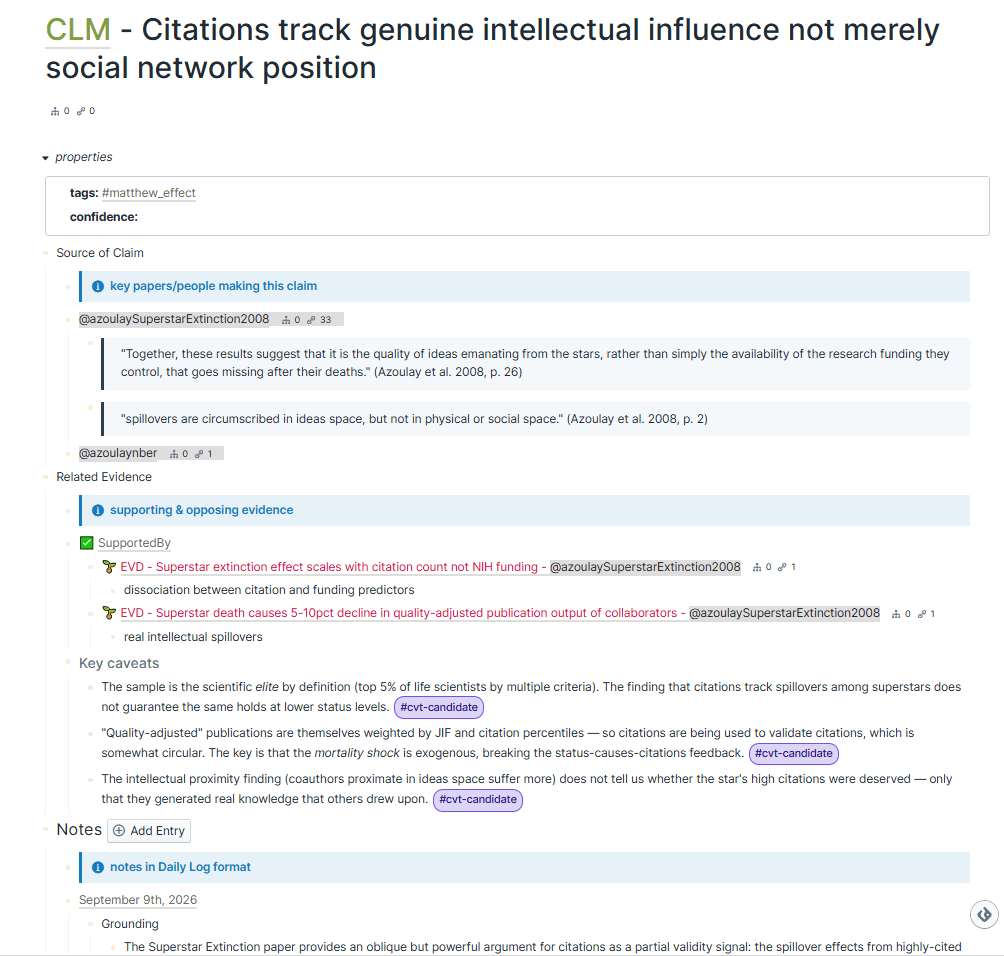
An example of a claim with caveats
You can modify your discourse graph templates to structure key information in a way that facilitates article writing later.
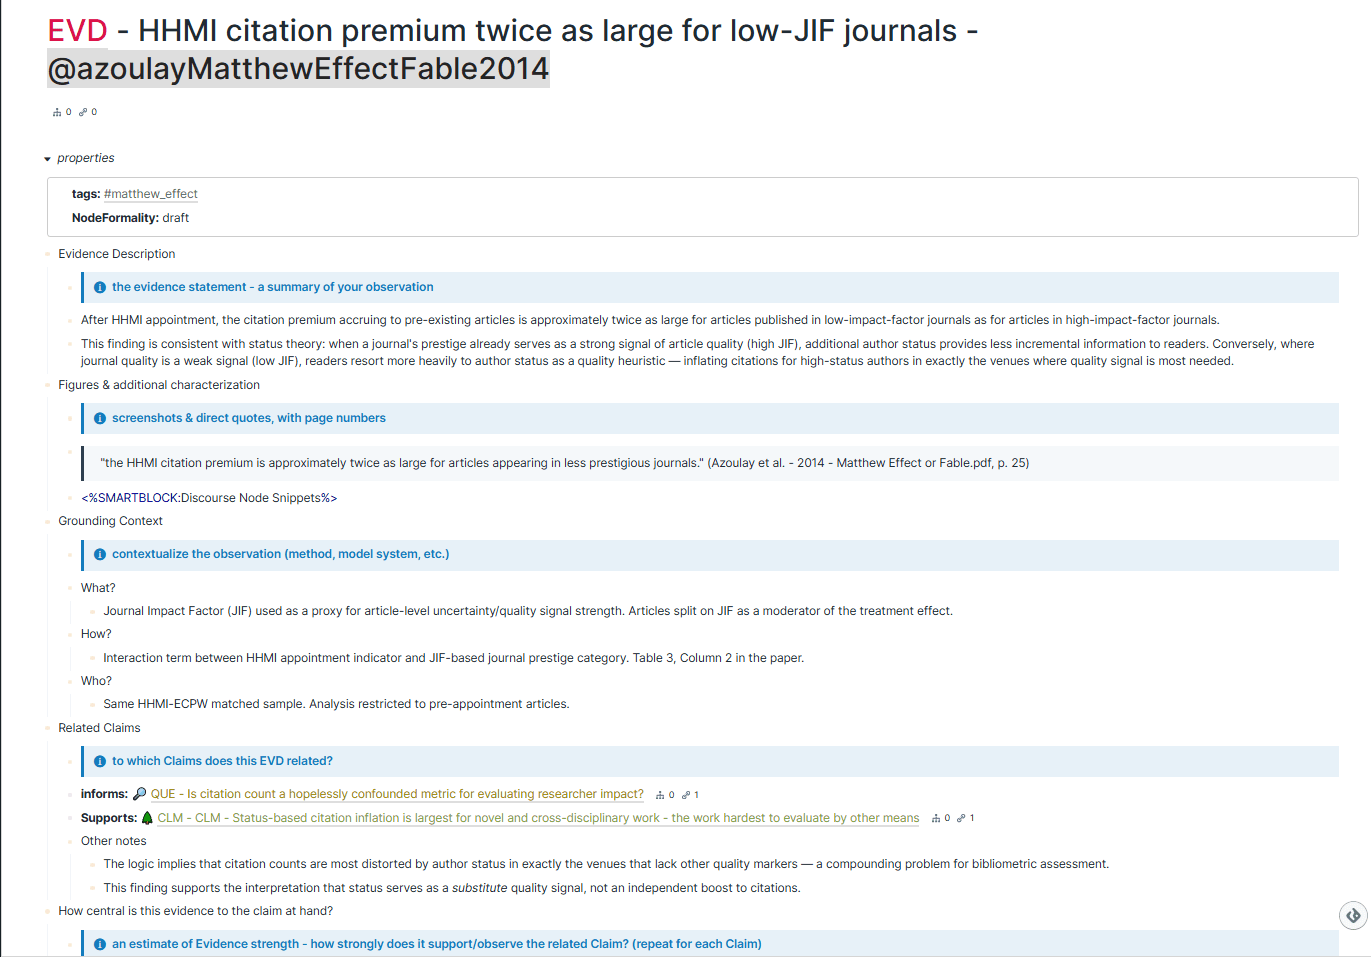
An example of an evidence node with methods context
Discourse nodes are modular and composable, and you can reuse them across multiple projects. One strategy to maximize composability is to capture “evergreen” information in the node template and add project-specific context in the “log” section.
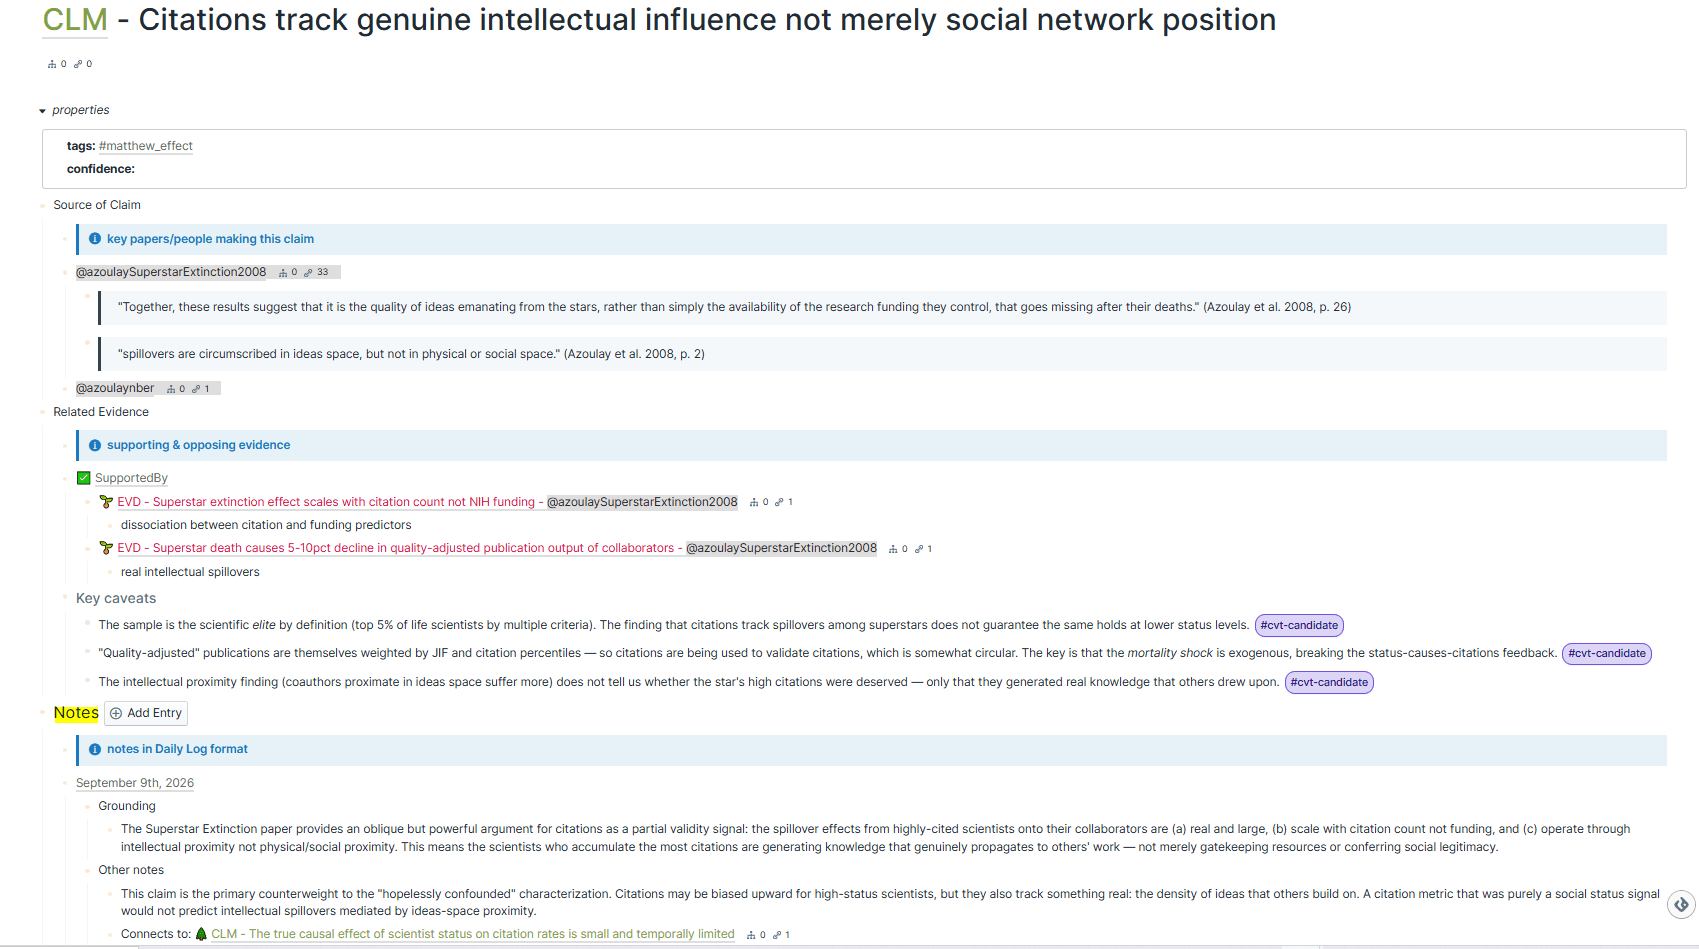
A claim template with a “Notes” section for logging observations in the context of a specific project
Exporting your graph
You can export your entire discourse graph in a format suitable for import into another Roam Research graph by selecting “Export All” from the Roam Settings menu and choosing “msgpack.” You can also export your graph as JSON or Markdown for import into other programs.
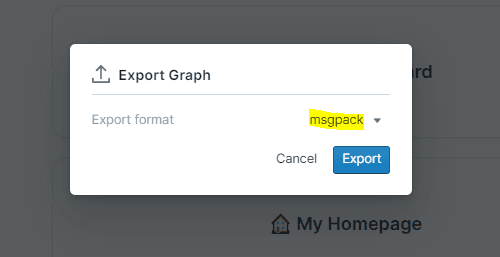
Exporting your entire graph